Hosted PBX - Users - Call Centre Supervisor Overview
Last Updated: Friday 5 May 2023
This will give you an overview of what the various features included with the Call Center Supervisor Role are used for.
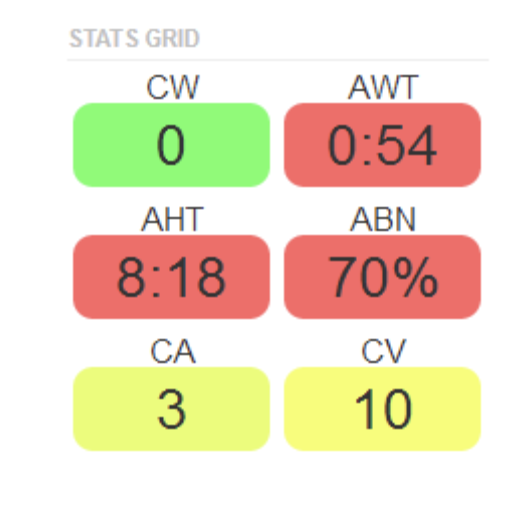
Stats Grid
The Stats Grid give you quick access to color-coded performance information based on configurable parameters.
Green = value accepted
Yellow = value is within the range of your lower threshold
Red = value meets or exceeds your upper threshold
White = no thresholds are configured for the statistic
 To edit the stats grid:
Click the Settings button above the stats grid. The Call Center Savings page appears, with the Stats Grid tab displayed
Configure the Lower and Upper Thresholds for the statistics you want to show on the stats grid

Click the General tab
Use the Service Level Agreement slider to specify a value that will be used to calculate the Service Level Percentage statistic. This value determines whether a call was answered in an acceptable amount of time (seconds)
Use Filter Stats Grid by Queue to determine whether the stats grid is shown for all call queues or one specific call queue
Click Save
Call Center Reports
The Portal can generate custom reports about call queues. These reports provide a graphical overview of call center statistics over a given period. The reports can cover the entire call center, queues, or individual agents. This granularity enables call center supervisors to monitor their call center.
To generate call center reports:
On the Call Center page, click the Reports tab
Select a date range
Use the Type drop-down list to select the type of report you want to generate (see the following sections for more information):
Queue Stats
Agent Stats
Agent Availability
DNIS (Dialed Number) Stats
Abandoned
Queue Stats
The Queue Stats report allows supervisors to view specific attributes on a queue-by-queue basis based on user-configurable attributes.
The drop-down list shown below allows you to select the information that will appear on the report

To change the available configuration fields, click the Table Settings gear from the pop up. When a list of check boxes appears, check the fields you want displayed and uncheck the ones you want to hide
You can now select the statistics you want shown on your report.
NOTE: You can click the check boxes in the first column for Call Queue statistics to graph them individually, as shown in the above figure with the different coloured rows. Clicking the first column header, which shows the bar graph icon, toggles all of check boxes on or off.
Was this helpful?